Jun 29, 2010

Tuesday update

Hello!!!
well the market has decided something different. No bounce to 10300 just plunged through the trend line to support level ~10800-10850.
Every single chart is now bearish:
- Weekly MACD below zero
- Weekly prices bellow EMA50
- Weekly histogram/stochastic pointing down
- Daily MACD curl over at the zero
- Daily histogram is pointing down and crossed below zero
- Daily triple cross

Now I am very bearish and this is the scenario with the highest probability until the market tells us something different.

BUT the prices still must close bellow support and break the third trend line.

A short-term hourly chart with bearish count.

Jun 27, 2010

Weekly review / Седмичен преглед

Hello, traders,
I have expected a red week, there we have it. The problem is the sell off was a little bit deeper and closed near to the lows for the week. Now we have second scenario which is equally probable.
Look at the first two charts - on the weekly chart we have bearish engulfing candle and the histogram has ticked lower. We have a double cross EMA5 is bellow MA20 for several weeks for the first time since the bottom March 2009. The prices are finding resistance at MA20 and are bellow it for several weeks. If DJ close lower next week and the candlestick is confirmed that will be very bearish.
Look at the second chart - daily. The prices have reversed hard from the EMA50 and MACD curls over at the zero line. If DJ break the third trend line and the support level the bears will win the war.

On the bullish side - both DJ and DAX are still in the Up channels and looking at the market breadth indicators I do not think that the UP swing is over.
Short term I think we will have Up first to resistance ~10300 - look at the third and fourth chart - DJ hourly. MACD is bouncing of the trend line and the histogram closed above the zero line after divergence.

On the third chart you can see the both scenarios with the Elliot wave count - green the bullish one and with red the bearish one.
Lets see what the market will do next week. Watch the support and resistance levels.


DAX Weekly - the same story bearish engulfing candle, reverses for the second time at resistance. But DAX looks stronger then DJ - EMA5 is above MA20 and MA20 above EMA50. It is too early to get bearish.

Dax Daily - touching the lower trend line and closed above MA20

Jun 21, 2010

Monday Update

On Sunday I wrote - "I think wave A is completed or we can see short lived rally on Monday to complete it."
Today the indexes have opened with huge gap higher hit the MA50 and reversed hard. mMm pattern on the Histogram and shooting star candle - wave "B" has began. First target Dow Jones 10300, DAX 6000.

Jun 20, 2010

Weekly review / Седмичен преглед

Hello traders!!!!!
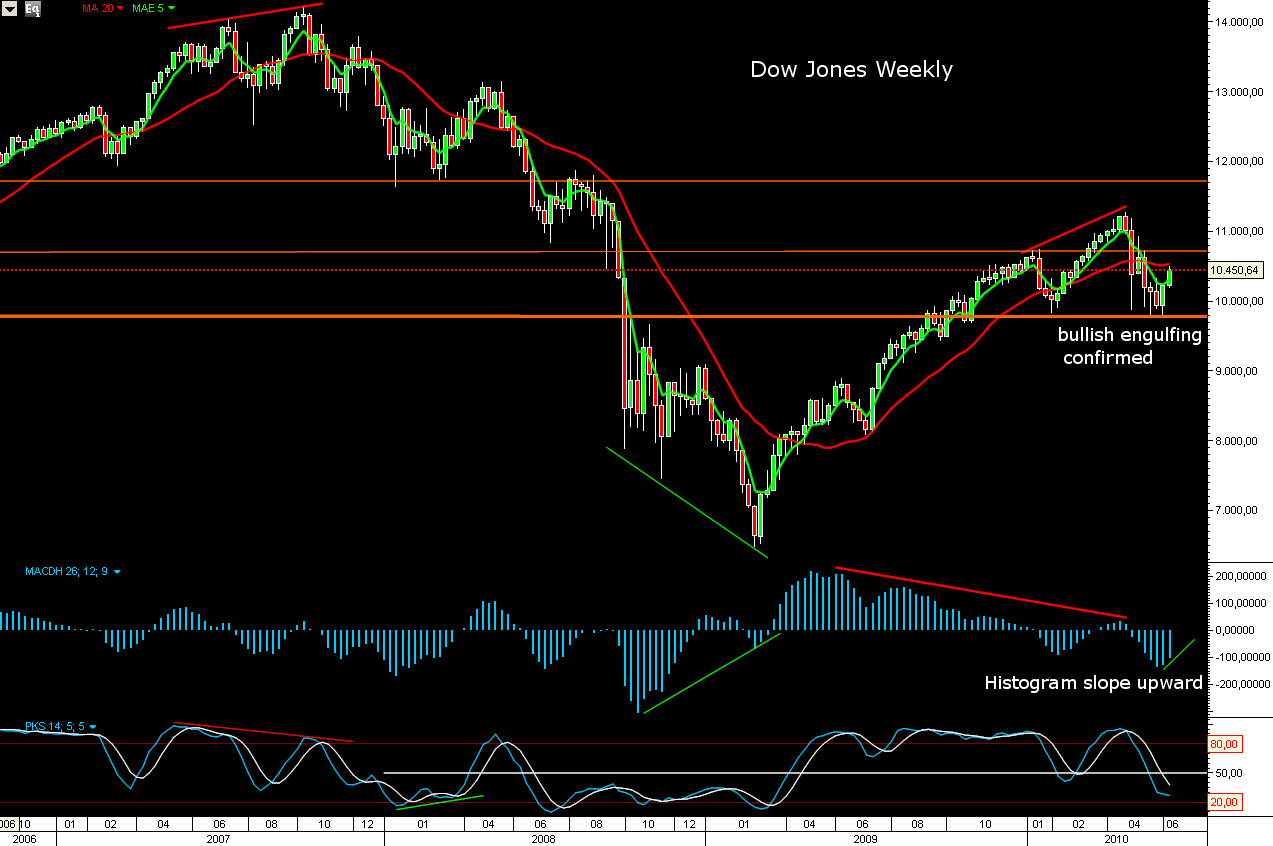
this week the market did exactly what I have been expecting - wave "A" to broke the neckline of a double bottom pattern and to see higher prices. On the weekly chart we have confirmed bullish engulfing and the histogram slope pointing upward. So for the next several weeks I am bullish and I am expecting to form a right shoulder of a Head&Shoulders topping pattern(Look at the first and second chart).

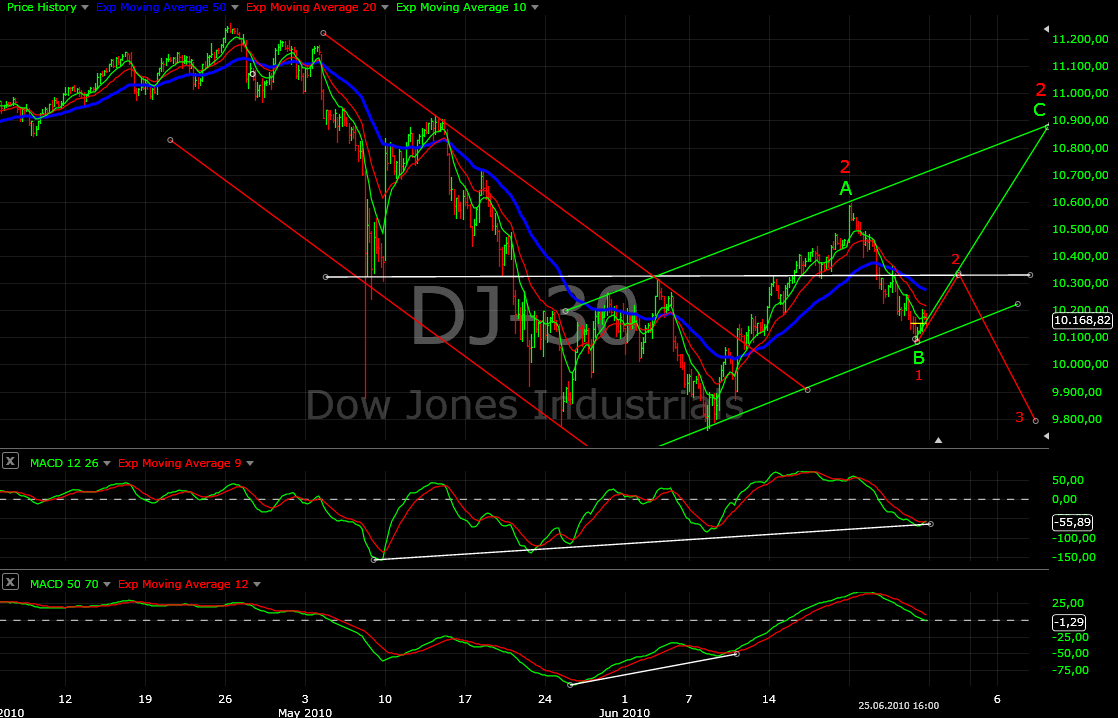
This is a corrective move so I expect some kind of zig-zag A-B-C (see the third chart). I think wave A is completed or we can see short lived rally on Monday to complete it. After that a pullback for several days 3 to 5 days, followed by final wave C to resistance 1(~10750) or resistance 2(~10900) to complete the right shoulder.

First - why to expect pullback and why just pullback and not next leg down?
I expect some kind of short lived pullback because:
- McClellan Oscillator hit extreme and is falling for the last 2 days (see the last chart)
- Histogram made very high tower and I expect the prices to cool down for several days
- The prices are hitting the EMA50 for the last 3 days finding resistance
- MACD Divergences on the hourly and 15-min charts
So it is wise to take some profits at this levels and wait for wave B when it is over to load up again.
Why not another leg down? - simple I do not see bearish signs at the moment.
- Daily MACD is pointing up
- Weekly histogram slope pointing up
- Bullish candle confirmed on the weekly chart
- Bullish percentage and McClellan Summation index pointing up

Second - what if I am wrong?
- If the prices just go higher and higher and make new highs... great we are on the right side of the trade:))))
- If that was wave 2 and this is the beginning of another leg down... so it be, we will follow the market. We do not have bearish sings(at least for the short term) so I will follow the signals which the market gives me. If it tells me something different next week I will change my bias right away:) - I will tell you, do not worry:)


Jun 16, 2010

Wave a has topped?

Look at the third chart bellow. I think wave a has topped. DJ MACD divergence on 15-min chart and Histogram divergence on the hourly charts.

Jun 13, 2010

Weekly review / Седмичен преглед

Hello traders!
for several weeks I am saying that the indexes will build a base and then we will see a rally. It took a little bit longer - three weeks, but there we are - bullish signs on all charts.
Why? - the indexes are in support zone and in the same time the market breadth indicators have hit extremes and telling us to expect a relief rally (look at the last two charts). Of course it takes time the selling pressure to disappear and that is exactly what is happening the last three weeks - a base has been build.

Now the charts - all time frame are now bullish:
Weekly chart - several candles with long shadows at support level - buyers are stepping in. Last week candle is bullish engulfing. The histogram has ticked UP - momentum is shifting.
Daily chart - divergences on the MACD and the Histogram - momentum is shifting. The prices are bouncing from support.
Hourly chart - MACD multiple points of divergence and broken trend line.

I think we have a double bottom. It is still not confirmed, but I expect that to happen next week.
I think we will see A-B-C rally which will last three-four weeks and make a lower high - part of a topping pattern. Target for the double bottom is ~10900, but we have a resistance zone between ~10500 and ~10750 and I expect the rally to peak somewhere there. The resistance levels are also Fibonacci levels - ~10500 50% retracement and ~10750 61,8% retracement of the entire sell off.


Jun 9, 2010

Back to work:)

Hello traders,
the market continues to build a base. I still believe that we will see a right shoulder in the range between 10500-10750.
On Sunday we will look at the charts and the indicators.

Jun 3, 2010

Short holiday

I will take a short brake, again four days in Bulgaria:) so no weekly review this weekend.
Look at the charts from the last week - everything is intact. Expect higher prices in the next week or two.