
Jun 30, 2013
Signals
Short term signal: DOWN
Intermediate term signal: DOWN
Comment: we have a strong reaction higher, but the price is still testing MA20 and MA50. I would enter long trade if a see
corective move lower with higher low.
Expected behavior for:
- sell off resumes - sharp move lower should begin
- the move higher is not finished - choppy reaction lower
Levels to watch SP500:
- 1640 61,8% retracement X pink?
- 1624 the gap - 50% retracement X pink?
- 1598 is now support
- 1582-1585 support, must hold if the low is in.
------------------------------
Levels to watch Xetra DAX:
- 7870-7840 - is support for the short term move down
- 8040 - is first resistance to the upside
- 8070-8130 - the gap/strong resistance/MA50
On the weekly chart I am posting for months that before a significant top we have acceleration phase(which is not "THE TOP"), correction, a rally to new highs and topping for a while. We had this behavior before the top in 2007 and before significant tops in 2010 and 2011. I wanted to see if the same pattern repeated in 2000... the answer is YES. I think that it is all about psychology - before the top the bears give up, everybody jump on the long side which causes strong rally, the bull burns its energy, the herd can not understand that the party is over which causes the new high and the smart guys need to offload their long position which causes the topping process before the reversal.
When we talk about psychology - I was asked once about gold after the first sell off... than I explained about psychology, that the first sell off is not the low, it is followed from a rebound and another sell off to lower low which should be the bottom. So if you interested in GOLD the bottom fishing can begin:)
Note - acceleration phase is not just a strong rally, it is all about time. Usually a rally lasts from 2-4 months than you have a correction. Rally lasting 5-6 months or longer without correction is indication for too much excitement, the greed can not be cleared, the bull burns its energy too fast which leads to a significant top.
Now why I post this chart - do you see the correction? It is 1:1 with my green scenario. I have no prove that the green scenario will play out, as I wrote it is more feeling... but I find the fact interesting and we will have a road map if it is the real deal:)

Jun 29, 2013
Weekly review
Short term view - one or two red days and up again
Intermediate term view - I am not sure if the intermediate term bottom is in.
This week the markets has followed my plan again moving higher and testing MA50, but compared to last week I have to change it a little bit:)
The move higher takes too long, we have green week, and the intra day charts show that we have corrective action, which means we are not finished to the upside. If I am right than we have two scenarios - one very simple the correction is over and the second complex correction which is still not finished.
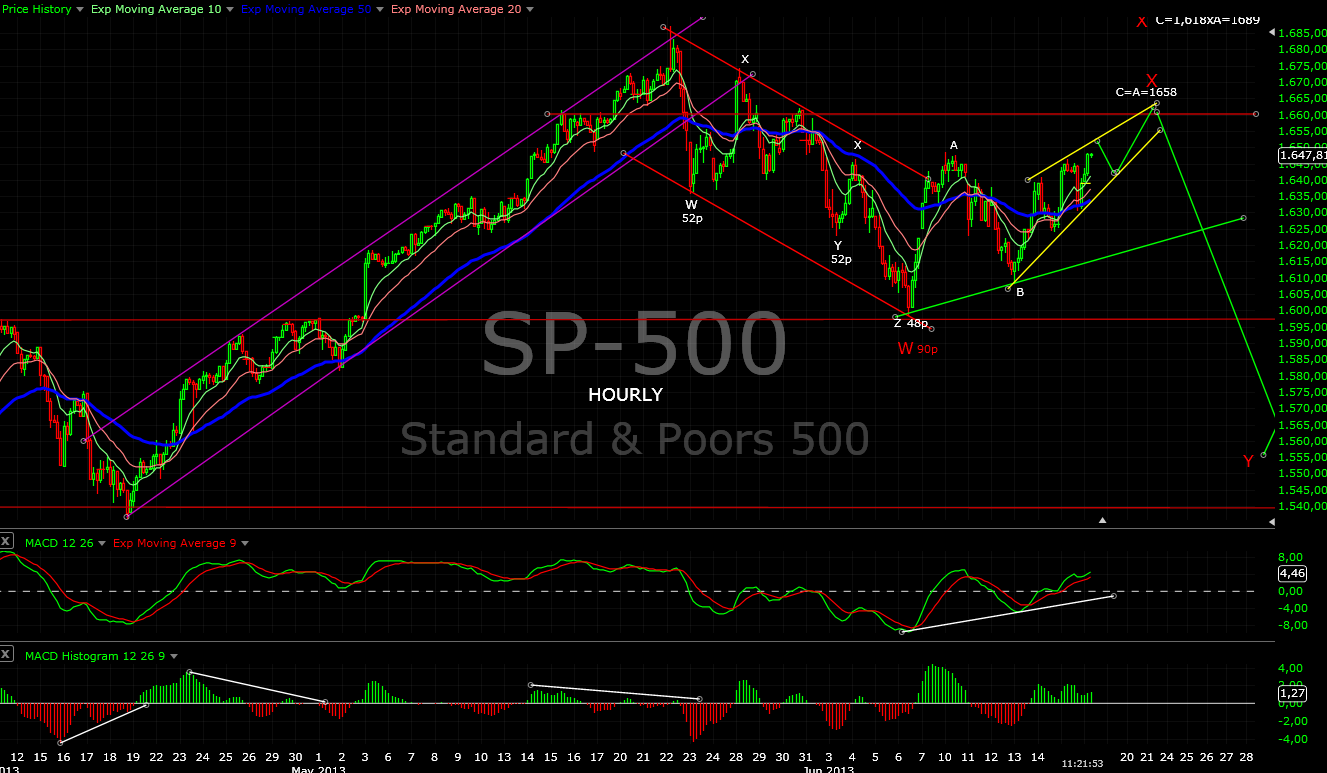
- the correction is over - we had a simple zig zag W-X-Y(red count on the hourly chart), Y=W, 7.5% correction (perfect between 7% and 8%), just 5 points shy of 38,2%, exactly the same development compared to the previous occasions of such strong rallys(see the weekly chart)
- complex correction - the red count is just part one or wave W pink(see the hourly chart) of something bigger and we are now in the middle of wave X pink.
It can sounds confusing, but the trading plan is simple - buy the dip as long as it stays above 61,8% Fibo or the 1582-1585 range.
TECHNICAL PICTURE
Short term - the action is corrective and after one or two red days the move up should continue. The line in the sand is 61,8% Fibo - the 1582-1585 range.
 - Triple cross(EMA10 and EMA20 crossing EMA50) - no clear direction.
Intermediate term - I am not sure which scenario has higher probability. My feeling says the green scenario, the logic(the indicators) are more favorable for the red one. I will just follow the market and not think too much:)
 - Trend direction EMA50/MACD - the price have tested EMA50 and MACD is bellow the zero line - the intermediate term trend stays negative.
- Momentum Histogram/RSI - momentum is short term up, but the histogram is still bellow zero and RSI is testing the 50 level... not strong enough for now.
Long term - no change, corrective move and higher high expected.
 - Trend direction EMA50/MACD - the long term trend is up.
- Momentum Histogram/RSI - momentum is pointing down, intermediate term trend is down.
MARKET BREADTH INDICATORS
The Market Breadth Indicators - do not help us much to decide which scenario is in play. They favor probably more the red scenario.... the interpretation can be ambiguous - I can say we had enough action to the downside and correction is over or one more push is missing.
McClellan Oscillator - moved to positive territory, which can be the correction is over, but it could be "every time when it moves to -100 it moves back above the zero line" but the correction is usually not over....
McClellan Summation Index - still on sell, does not help us much.
Weekly Stochastic of the Summation Index - sell signal. Reached oversold territory the usual behavior is expect reversal in the next 1-2 weeks.
Bullish Percentage - sell signal... does not moved to the usual levels for a correction 40-50...
Percent of Stocks above MA50 - just 2 points shy of 25%... the correction could be over or not...
Fear Indicator VXO - touched 22... the correction could be over or not...
Issues Advancing - the divergence warned us for a reversal... he correction could be over
Issues Declining - the divergence warned us for a reversal... he correction could be over
HURST CYCLES
If the green scenario plays out the count stays the same. If we see the red scenario developing than we have saw already 20 and 40 week cycle bottom.

The same story here we will see how it develops to adjust the 20 and 40 week cycle bottom.

Tom Demark SEQUENTIAL AND COUNTDOWN - this technique spots areas of exhaustion.
Nothing interesting - 3 of a sell setup on the daily chart and 3 of a buy setup on the weekly chart.

Intermediate term view - I am not sure if the intermediate term bottom is in.
This week the markets has followed my plan again moving higher and testing MA50, but compared to last week I have to change it a little bit:)
The move higher takes too long, we have green week, and the intra day charts show that we have corrective action, which means we are not finished to the upside. If I am right than we have two scenarios - one very simple the correction is over and the second complex correction which is still not finished.
- the correction is over - we had a simple zig zag W-X-Y(red count on the hourly chart), Y=W, 7.5% correction (perfect between 7% and 8%), just 5 points shy of 38,2%, exactly the same development compared to the previous occasions of such strong rallys(see the weekly chart)
- complex correction - the red count is just part one or wave W pink(see the hourly chart) of something bigger and we are now in the middle of wave X pink.
It can sounds confusing, but the trading plan is simple - buy the dip as long as it stays above 61,8% Fibo or the 1582-1585 range.
TECHNICAL PICTURE
Short term - the action is corrective and after one or two red days the move up should continue. The line in the sand is 61,8% Fibo - the 1582-1585 range.

Intermediate term - I am not sure which scenario has higher probability. My feeling says the green scenario, the logic(the indicators) are more favorable for the red one. I will just follow the market and not think too much:)

- Momentum Histogram/RSI - momentum is short term up, but the histogram is still bellow zero and RSI is testing the 50 level... not strong enough for now.
Long term - no change, corrective move and higher high expected.

- Momentum Histogram/RSI - momentum is pointing down, intermediate term trend is down.
MARKET BREADTH INDICATORS
The Market Breadth Indicators - do not help us much to decide which scenario is in play. They favor probably more the red scenario.... the interpretation can be ambiguous - I can say we had enough action to the downside and correction is over or one more push is missing.
McClellan Oscillator - moved to positive territory, which can be the correction is over, but it could be "every time when it moves to -100 it moves back above the zero line" but the correction is usually not over....
McClellan Summation Index - still on sell, does not help us much.
Weekly Stochastic of the Summation Index - sell signal. Reached oversold territory the usual behavior is expect reversal in the next 1-2 weeks.
Bullish Percentage - sell signal... does not moved to the usual levels for a correction 40-50...
Percent of Stocks above MA50 - just 2 points shy of 25%... the correction could be over or not...
Fear Indicator VXO - touched 22... the correction could be over or not...
Issues Advancing - the divergence warned us for a reversal... he correction could be over
Issues Declining - the divergence warned us for a reversal... he correction could be over
HURST CYCLES
If the green scenario plays out the count stays the same. If we see the red scenario developing than we have saw already 20 and 40 week cycle bottom.

The same story here we will see how it develops to adjust the 20 and 40 week cycle bottom.

Tom Demark SEQUENTIAL AND COUNTDOWN - this technique spots areas of exhaustion.
Nothing interesting - 3 of a sell setup on the daily chart and 3 of a buy setup on the weekly chart.

Jun 27, 2013
Signals
Short term signal: UP
Intermediate term signal: UP
Comment: the move up does not look finished...at least one more push before anything on the downside. The intermediate term signal turned up but I would wait for a higher low to confirm trend reversal. The move is just testing the break bellow MA20/MA50 on the daily chart and it does not look so strong. One strong hourly candle after the open and no follow trough.
Expected behavior for:
- sell off resumes - sharp move lower should begin
- higher low - weak reaction lower from this levels or higher levels
Levels to watch SP500:
- 1624 the gap - the stop for an intermediate term trade
- 1610 last minor low above that short term signal stays up bellow that down again
- 1598 is now support
------------------------------
Levels to watch Xetra DAX:
- 7920 - is support for the short term move up
- 8040 - is first resistance to the upside
- 8070-8130 - the gap/strong resistance/MA50
Short term update
UPDATE: the stop for the short term signal is now at 1611
I was wrong about taking profits... The short term support is now at 1606 the gap. The price is testing MA20 and MA50 on the daily chart, on the hourly chart the price broke the wedge trend line and now we have a channel. V shape bottom... I am not really convinced, but we will follow the signs. The short term signal provided nice profits.
Jun 26, 2013
Signals
Short term signal: UP
Intermediate term signal: DOWN
Comment: the price is in the middle of the resistance zone. On the daily chart the move looks strong, but the internal structure is corrective.
I expect some reaction at this levels, if higher low is to expect or the sell off will resume is another story(see the chart bellow).
Expected behavior for:
- sell off resumes - sharp move lower should begin
- higher low - weak reaction lower from this levels or higher levels
Levels to watch SP500:
- 1594 last minor low above that short term signal stays up bellow that down again
- 1598-1608 strong resistance, a move higher should not exceed this range
- 1622 bellow that level stay short(intermediate term trend)
------------------------------
Levels to watch Xetra DAX:
- 7920 - is support for the short term move up
- 7980 - is first resistance to the upside
- 8070-8130 - the gap/strong resistance/MA50
Short term update
UPDATE: the last minor low is now 1594 this is the level to watch for a short term reversal.
In the middle of the resistance zone 1598-1608 hitting 1603 and EMA50 on the hourly chart.... do not get greedy take profits. There is high probability that this is the top for the bounce but we have no confirmation for now.
Current scenarios...


Jun 25, 2013
Signals
Short term signal: UP
Intermediate term signal: DOWN
Comment: we have a green day and a bounce, but I think it is early for a reversal.
Expected behavior for:
- not sure how exactly the bounce will develop
Levels to watch SP500:
- 1582 last minor low above that short term signal stays up bellow that down again
- 1598-1608 strong resistance, a move higher should not exceed this range
- 1622 bellow that level stay short(intermediate term trend)
------------------------------
Levels to watch Xetra DAX:
- 7770 - is support for the short term move up
- 7850-7870 - is first resistance to the upside
- 8070-8130 - the gap/strong resistance/MA50
Short term update
Good time to take profits or move the stop for short term long trades bellow 1582 - last minor low.
UPDATE:
The move lower does not look impulsive so probably some kind of wedge/ending diagonal.
The current bounce higher is corrective too. I do not know if it will move higher, make some zig-zag or the sell off will resume.
I know that it is weak and the lows will be revisited some day.
I know that 1582 is the last minor low and move bellow will switch the short term signal to down again.
The market needs a pause for 2-3 days so my bet is the zig-zag the small red lines before resume of the sell off.


Jun 24, 2013
Signals
Short term signal: UP
Intermediate term signal: DOWN
Comment: the indexes are short term oversold and such a bounce is not a surprise. The charts are still very negative and it is early for a reversal.
Expected behavior for:
- some kind of a short term bottom - tomorrow should be a green day
Levels to watch SP500:
- 1571 last minor support above that short term signal stays up bellow that down again
- 1622 bellow that level stay short(intermediate term trend)
- 1598-1608 strong resistance, a move higher should not exceed this range
-------------------------------
Levels Xetra DAX:
- 7640 - is support level
- 7770-7780 - is now resistance
- 7870 - is the next resistance and the target if the price moves above 7770-7780
- 8070-8130 - the gap/strong resistance/MA50
Short term update
We have already 90 points drop which is the same size like the first wave lower which started on 22 May. Bounce should start??? Of course it is too early for long trades.
UPDATE: we have the bounce, the path which I see is shown bellow. 1598-1608 is strong resistance and I do not see this move continuing above this range without some test of the low.
It did not play out exactly as I have expected, but as I said on the weekend the indexes are short term oversold and if you are a good day trader you can play the bounce.


Jun 23, 2013
Signals
Short term signal: DOWN
Intermediate term signal: DOWN
Comment: the oscillators are oversold double divergence on the NYMO, I think we will see move higher at least to resistance ~1622
Expected behavior:
- some kind of a short term bottom, on Monday we should not see lower low
Levels to watch SP500:
- 1622 bellow that level stay short(intermediate term)
- 1600 above that level bounce has begun, and short term long signal will be generated
- 1560-1550 first target lower(intermediate term)
Levels Xetra DAX:
- 7770-7780 - is support, I expect a bounce from this level
- 7870 - is first resistance to the upside
- 8070-8130 - the gap/strong resistance/MA50
Jun 22, 2013
Weekly review
Short term view - bounce higher
Intermediate term view - correction for 2-4 weeks
Trading system signal (swing trading) - Direction: DOWN | Last entry signal: at SP500=1622 on 20.06 | Stop at: 1622
The markets follow my plan:) so no need to change something.
Next week a bounce higher should start. The two resistance areas are around 1610 and 1620. The strength of the move will tell us what to expect.
I see two scenarios
- weak bounce to 1610 will probably mean impulsive down leg to lower levels ~1510 / Y=1,618xW / 50% Fibo retracement / MA200(red scenario)
- sharp rally to ~1620 and retest of the broken trend line and MA50 will probably mean three wave structure lower with target 1550-1560 / Y=W / 38,2% Fibo(green scenario).
What are saying the indicators - advancing issues and McClellan Oscillator are making higher lows, the internals to the downside are not so strong which means the bounce should be strong not just 1-2 days sideway affair.
Previous occasions of similar moves on which my forecast is based(see the weekly chart) - normal correction 7%-8% followed which was 38,2% Fibo retracement.
Because of the reasons above I am favoring the green scenario that the move lower will not be very deep. We will see what the market has to say. Anyway a bounce higher is a sell opportunity and if you a good day trader you can play the bounce higher. On Monday I expect initial move lower which should be a good buy opportunity to ride the bounce.
TECHNICAL PICTURE
Short term - both scenarios are shown on the chart. On the smaller time frames it looks like inverse H&S is taking shape. Probably we will see the right shoulder forming on Monday and short term bottom followed by a move higher.
 - Triple cross(EMA10 and EMA20 crossing EMA50) - the moving averages are pointing down, the short term trend is down.
Intermediate term - I have explained above about the targets for the two scenarios, you can see them on the chart.
 - Trend direction EMA50/MACD - the price moved bellow MA50 and MACD bellow the zero line, the intermediate term trend is down.
- Momentum Histogram/RSI - momentum is pointing down too.
Long term - the market action confirms the plan for now, so no change here.
 - Trend direction EMA50/MACD - price is above EMA50 and MACD above zero so the long term trend is up.
- Momentum Histogram/RSI - RSI broke bellow its trend line and the histogram is bellow the zero line, the intermediate term trend is down.
MARKET BREADTH INDICATORS
The Market Breadth Indicators - e oscillators are making higher lows, trend following indicators are near to their targets for a correction. I think there is more on the downside but not too much as points and time.
McClellan Oscillator - two consecutive higher lows and double divergence.
McClellan Summation Index - sell signal. Lost more than 1200 points and now bellow the zero line.
Weekly Stochastic of the Summation Index - sell signal. Reached oversold territory the usual behavior is expect reversal in the next 1-2 weeks.
Bullish Percentage - sell signal. Not very impressed from the sell off still at elevated levels.
Percent of Stocks above MA50 - sell signal. Moved lower to 36 which is not far from 25 the usual target for a correction.
Fear Indicator VXO - exploded higher and almost touched 22. That is what you want to see during a correction.
Issues Advancing - making higher lows, more issues are advancing.
Issues Declining - making lower highs, we have less declining issues.
HURST CYCLES
I have changed the count a little bit. The last two 20 day cycles are a little bit stretched, but I think this is the right count and after the correction is finished we will see an intermediate term bottom marking 20 and 40 week cycle low.

The 40 week cycle making nice arch. Its top was late in the cycle at week 26, which means that the cycle of a higher degree, the 18 month cycle, still has not topped out. After the correction is over, we should see at least a tests of the highs.

Tom Demark SEQUENTIAL AND COUNTDOWN - this technique spots areas of exhaustion.
Second bar of a buy setup on the weekly chart. Another 7 weeks lower to finish it... a little bit too long for the correction and I think this setup will not be finished.

DAX chart - the price hit the trend line and support level and I think we will see rebound followed by another drop to the next support level and 38,2% Fibo around 7500 to form a nice parallel channel
Intermediate term view - correction for 2-4 weeks
Trading system signal (swing trading) - Direction: DOWN | Last entry signal: at SP500=1622 on 20.06 | Stop at: 1622
The markets follow my plan:) so no need to change something.
Next week a bounce higher should start. The two resistance areas are around 1610 and 1620. The strength of the move will tell us what to expect.
I see two scenarios
- weak bounce to 1610 will probably mean impulsive down leg to lower levels ~1510 / Y=1,618xW / 50% Fibo retracement / MA200(red scenario)
- sharp rally to ~1620 and retest of the broken trend line and MA50 will probably mean three wave structure lower with target 1550-1560 / Y=W / 38,2% Fibo(green scenario).
What are saying the indicators - advancing issues and McClellan Oscillator are making higher lows, the internals to the downside are not so strong which means the bounce should be strong not just 1-2 days sideway affair.
Previous occasions of similar moves on which my forecast is based(see the weekly chart) - normal correction 7%-8% followed which was 38,2% Fibo retracement.
Because of the reasons above I am favoring the green scenario that the move lower will not be very deep. We will see what the market has to say. Anyway a bounce higher is a sell opportunity and if you a good day trader you can play the bounce higher. On Monday I expect initial move lower which should be a good buy opportunity to ride the bounce.
TECHNICAL PICTURE
Short term - both scenarios are shown on the chart. On the smaller time frames it looks like inverse H&S is taking shape. Probably we will see the right shoulder forming on Monday and short term bottom followed by a move higher.

Intermediate term - I have explained above about the targets for the two scenarios, you can see them on the chart.

- Momentum Histogram/RSI - momentum is pointing down too.
Long term - the market action confirms the plan for now, so no change here.

- Momentum Histogram/RSI - RSI broke bellow its trend line and the histogram is bellow the zero line, the intermediate term trend is down.
MARKET BREADTH INDICATORS
The Market Breadth Indicators - e oscillators are making higher lows, trend following indicators are near to their targets for a correction. I think there is more on the downside but not too much as points and time.
McClellan Oscillator - two consecutive higher lows and double divergence.
McClellan Summation Index - sell signal. Lost more than 1200 points and now bellow the zero line.
Weekly Stochastic of the Summation Index - sell signal. Reached oversold territory the usual behavior is expect reversal in the next 1-2 weeks.
Bullish Percentage - sell signal. Not very impressed from the sell off still at elevated levels.
Percent of Stocks above MA50 - sell signal. Moved lower to 36 which is not far from 25 the usual target for a correction.
Fear Indicator VXO - exploded higher and almost touched 22. That is what you want to see during a correction.
Issues Advancing - making higher lows, more issues are advancing.
Issues Declining - making lower highs, we have less declining issues.
HURST CYCLES
I have changed the count a little bit. The last two 20 day cycles are a little bit stretched, but I think this is the right count and after the correction is finished we will see an intermediate term bottom marking 20 and 40 week cycle low.

The 40 week cycle making nice arch. Its top was late in the cycle at week 26, which means that the cycle of a higher degree, the 18 month cycle, still has not topped out. After the correction is over, we should see at least a tests of the highs.

Tom Demark SEQUENTIAL AND COUNTDOWN - this technique spots areas of exhaustion.
Second bar of a buy setup on the weekly chart. Another 7 weeks lower to finish it... a little bit too long for the correction and I think this setup will not be finished.

DAX chart - the price hit the trend line and support level and I think we will see rebound followed by another drop to the next support level and 38,2% Fibo around 7500 to form a nice parallel channel

Jun 20, 2013
Short term update
Short term signal: DOWN
Intermediate term signal: DOWN
Comment: Opening with gap bellow support 1622 and everything was clear. We have second big red candle bellow support/MA50/trend line.... there is no much to discuss
Expected behavior:
- move lower - any move higher should stay bellow 1622.
Levels to watch SP500:
- 1622 bellow that level stay short
- 1600 above that level bounce higher has begun
- 1560-1550 first target
Levels Xetra DAX:
- 7880 - is support and I think it will hold for several days
- 7750 - is next support/trend line/MA200 and I think it is target for this correction
- 8050 - the gap and resistance
UPDATE: the first try to guess the path not successful:)
With gap bellow support 1622 is obviously that the move lower has begun.


Jun 19, 2013
Short term update
Short term signal: DOWN
Intermediate term signal: NEUTRAL
Comment: whipsaws all the time in the last two weeks so I do not trade the signals, I trade short term weakness or strength. That is all you can do. For example DAX was weak, I was short and took small gain today.
UPDATE: now I looked better and we have bearish candle with low bellow the previous two days low and bellow MA20. There is probability that the move higher is over with Y finished (see the chart bellow). If you see weak bounce higher which can not manage to close above MA20 on the daily chart and MA50 on the hourly chart that will be nice short entry.
Expected behavior(see the daily chart from weekly review):
- the move on the upside is not over - the price should stay above 1620. Move to support and rally from it.
- the move is over another big red candle lower moving bellow 1620
Levels to watch SP500:
- 1622 should hold
- 1660 is possible target
The picture on the DAX looks a little bit more clear and it suggests one more wave up.
Levels Xetra DAX:
- 8080-8100 - next support, 8150-8160 support was tested twice today but I am not sure that it will hold
- 8240 resistance
As I have wrote yesterday buy signal but would rather take profits. The whole move is very weak and choppy but I think it is still not over.


Jun 18, 2013
Short term update
Short term signal: UP
Intermediate term signal: UP
Comment: at last the bulls moved the price above MA20 and the previous day high. We have long signal but I will be very careful, the intraday looks very ugly
I would take profits. Tomorrow is FOMC usually a event marking reversals....
Expected behavior:
- more upside - the price should stay above support and MA20 ~1640
Levels to watch SP500:
- 1640 should hold
- 1660 is possible target
Levels Xetra DAX:
DAX the upper trend line is tested again and the move looks very very weak, it can plunge any moment....
- 8175 support support
- 8250 resistance
And still the main scenario is playing out... with very weak and choppy wave, but is it still C wave up. The index moved above MA20 on the daily chart and as long as it stays above it(~1640) we have an ending diagonal higher.

Jun 17, 2013
Short term update
UPDATE: Very interesting option (thanks to thewavetrading) - triangle which will resolve upwards. That fits my plan, explains the mess and there will be time the oscillators to be reseted.
Short term signal: NO CLEAR DIRECTION
Intermediate term signal: NO CLEAR DIRECTION
Comment: I do not have an idea - the price is playing with EMA50 on the hourly chart. We saw another battle for MA20 on the daily chart and
another reversal. The price is trapped for more than 2 weeks in the MA50-MA20 range. Soon we will see strong move up or down.
Expected behavior:
- break to the upside - strong move higher tomorrow
- triangle - red day tomorrow and move to ~1620 for wave D
Levels to watch SP500:
- 1645 is resistance
- 1620 is support
Levels to watch Xetra DAX:
DAX gapped above resistance 8150 and MA50 but lost most of the gains and testing the range 8150-8160 now support. This level must hold if the index will move higher.
- 8150-8160 support
- 8280-8300 resistance
More confusion, another unsuccessful battle for the bulls for MA20 on the daily chart... I think the triangle has the highest probability now, unless SP500 rallies in the last 40 minutes.


Jun 16, 2013
Short term update
Short term signal: NO CLEAR DIRECTION
Intermediate term signal: NO CLEAR DIRECTION
Comment: there is no clear direction, the price is still trapped between MA50 and MA20 bouncing between them. The range 1613-1642 is getting tighter.
The price needs to move bellow or above this range to have some signal. I think the break out will be to the upside but not for a huge
or a long lasting rally, only several days.
Expected behavior(see the daily chart from weekly review):
- break to the upside - low higher than 1609 followed by move above 1640
- break to the downside - high lower than 1640 followed by a sharp move lower
Levels SP500:
- 1640 if the price moves above the last high long signal will be generated
- 1609 if the price moves bellow the last low short signal will be generated
Levels Xetra DAX:
DAX gapped bellow support 8050 and MA50 but recovered. This level must hold if the index will move higher.
- 8150-8160 resistance move above this level will trigger long signal
- 8040 support move bellow this level will trigger short signal
Jun 15, 2013
Weekly review
Short term view - more to the upside
Intermediate term view - after last final move higher we should see a correction.
Trading system signal (swing trading) - Direction: NEUTRAL | Last entry signal: at SP500=.... on xx.xx.xx | Stop at:
Volatile market and complicated choppy pattern, the bottom and the trend line have been tested, but if you take a step back and look at the bigger picture the plan has not changed and it is in tact. I have posted once a NYMO chart comparing the indicator and the SP500 now and in April 2012 - for now the market action is repeating and if the patterns stays the same we should see several green days.
We have NYMO and histogram moving higher, momentum is turning up, SP500 bouncing for the second time from the trend line and MA50, MACD turning up from the zero line, on the DAX we have even histogram divergence, so I think that the green scenario from the charts bellow, has much higher probability. That means at least several green days or test of the high.
TECHNICAL PICTURE
Short term - looking only the chart the triangle and the red scenario looks possible, but looking at the daily chart and the indicators the green scenario has much higher probability even if we test the lower yellow trend line.
 - Triple cross(EMA10 and EMA20 crossing EMA50) - short term trend not clear.
Intermediate term - I think the momentum is turning up and usually when NYMO hits -100 it moves above zero before any move lower resumes. This confirms the forecast for a short term move up. The subsequent correction will not be deeper than 38,2%.
 - Trend direction EMA50/MACD - MACD tries to turn up from the zero line and the price is still above EMA50. The intermediate term trend is still up.
- Momentum Histogram/RSI - start turning up.
Long term - no change
 - Trend direction EMA50/MACD - price is above EMA50 and MACD above zero so the long term trend is up.
- Momentum Histogram/RSI - momentum is down which is a warning that anything on the upside should be short living.
MARKET BREADTH INDICATORS
The Market Breadth Indicators - do not give much information if we are near a top or a bottom, probably because we are still in the middle of a corrective move.
McClellan Oscillator - moving higher after oversold levels. Usually it moves into positive territory after hitting -100. That means relief rally for at least several days.
McClellan Summation Index - sell signal. It plunged 1000 saying we are in a correction.
Weekly Stochastic of the Summation Index - sell signal. Very near to oversold levels. We are probably 2-3 weeks away from intermediate term bottom.
Bullish Percentage - sell signal, but still elevated levels.
Percent of Stocks above MA50 - in no mans land ~50%-60%
Fear Indicator VXO - fear has spiked up which is normal. For a real correction it should move above 20.
Issues Advancing - improving after extremes supporting the idea fro a bounce upward.
Issues Declining - we have less decliners after hitting extremes.
HURST CYCLES
The move was very weak and that does not look like 20 and 40 week cycle low. We are in the last 20 trading day cycle and we have not seen the bottom.

I think we have not seen the bottom and this cycle will be a little bit longer than the usual.

Tom Demark SEQUENTIAL AND COUNTDOWN - this technique spots areas of exhaustion.
A mess on the daily chart and a price flip on the weekly chart, which confirms that momentum has turned down on the weekly time frame.

The monthly chart - combo and countdown are finished later this year a significant correction should begin. The price is way too far from MA20, testing the upper trend line so it needs to cool down.

Intermediate term view - after last final move higher we should see a correction.
Trading system signal (swing trading) - Direction: NEUTRAL | Last entry signal: at SP500=.... on xx.xx.xx | Stop at:
Volatile market and complicated choppy pattern, the bottom and the trend line have been tested, but if you take a step back and look at the bigger picture the plan has not changed and it is in tact. I have posted once a NYMO chart comparing the indicator and the SP500 now and in April 2012 - for now the market action is repeating and if the patterns stays the same we should see several green days.
We have NYMO and histogram moving higher, momentum is turning up, SP500 bouncing for the second time from the trend line and MA50, MACD turning up from the zero line, on the DAX we have even histogram divergence, so I think that the green scenario from the charts bellow, has much higher probability. That means at least several green days or test of the high.
TECHNICAL PICTURE
Short term - looking only the chart the triangle and the red scenario looks possible, but looking at the daily chart and the indicators the green scenario has much higher probability even if we test the lower yellow trend line.

Intermediate term - I think the momentum is turning up and usually when NYMO hits -100 it moves above zero before any move lower resumes. This confirms the forecast for a short term move up. The subsequent correction will not be deeper than 38,2%.

- Momentum Histogram/RSI - start turning up.
Long term - no change

- Momentum Histogram/RSI - momentum is down which is a warning that anything on the upside should be short living.
MARKET BREADTH INDICATORS
The Market Breadth Indicators - do not give much information if we are near a top or a bottom, probably because we are still in the middle of a corrective move.
McClellan Oscillator - moving higher after oversold levels. Usually it moves into positive territory after hitting -100. That means relief rally for at least several days.
McClellan Summation Index - sell signal. It plunged 1000 saying we are in a correction.
Weekly Stochastic of the Summation Index - sell signal. Very near to oversold levels. We are probably 2-3 weeks away from intermediate term bottom.
Bullish Percentage - sell signal, but still elevated levels.
Percent of Stocks above MA50 - in no mans land ~50%-60%
Fear Indicator VXO - fear has spiked up which is normal. For a real correction it should move above 20.
Issues Advancing - improving after extremes supporting the idea fro a bounce upward.
Issues Declining - we have less decliners after hitting extremes.
HURST CYCLES
The move was very weak and that does not look like 20 and 40 week cycle low. We are in the last 20 trading day cycle and we have not seen the bottom.

I think we have not seen the bottom and this cycle will be a little bit longer than the usual.

Tom Demark SEQUENTIAL AND COUNTDOWN - this technique spots areas of exhaustion.
A mess on the daily chart and a price flip on the weekly chart, which confirms that momentum has turned down on the weekly time frame.

The monthly chart - combo and countdown are finished later this year a significant correction should begin. The price is way too far from MA20, testing the upper trend line so it needs to cool down.

Jun 13, 2013
Short term update
Short term signal: UP
Intermediate term signal: UP
Comment: a lot of volatility - strong push lower, the futures with huge gap to the previous low. I was thinking already that am completely wrong
and I am really too bullish... at the end we have the expected bottom and a huge green bar. Nothing changed, the plan stays the same.
Next target should be 1660.
Expected behavior(see the daily chart from weekly review):
- green scenario retest of the high - I expect A-B-C higher. This should be A (not finished), a B wave should stay above 1622 and C to 1660.
Levels SP500:
- support - 1622 should hold
- resistance 1640-1647
Levels Xetra DAX:
- resistance 8150-8160
- support 8050
Short term update
UPDATE: I think this could be classified as a huge green bar so the red scenario bellow is winning the battle.
The futures plunged to the previous low 1598 but the index has recovered currently 15min before the open. I think that can change the plan, I will post charts later....
The Index has recovered and the move on the chart which I have posted yesterday is playing out. The chart of the cash index looks normal an the forecasted move higher looks possible and in tact. The futures(my charts CFD) made nice double bottom but no divergence. On the other side the DAX look bad. The DAX gaped bellow support and MA50 and the chart tells me the middle section before the beginning of the significant part of the correction is over. This will fit with the oversold indicators and the signs that we are nearing intermediate term bottom.
The green scenario fits more to DAX and the red one more to SP500. I must says that I am confused, usually the indexes move synchronously....
Huge green bar will mean the red scenario, not convincing move higher for a day or two will mean the green scenario


Jun 12, 2013
Short term update
Short term signal: DOWN
Intermediate term signal: DOWN
Comment: The price is testing the trend line and MA50 on the daily chart again. Given the Oversold oscillators and the corrective move lower...
I do not know if I am too bullish but this does not look to me like the start of a new move rather like the end of a move lower.
The fact is there is no signs for are bottom, both time frames are pointing down, so surprises could not be excluded.
Expected behavior(see the daily chart from weekly review):
- green scenario retest of the high - we should see short term bottom soon and strong green day. If this does not happen it will be very suspicious and the road will be a little bit different - marginal new low bellow 1600 before move higher.
Levels SP500:
- 1622 is resistance now
- 1600-1620 wait and see what happens
- bellow 1600 is bearish
Levels Xetra DAX:
- 8050-8150 wait and see what happens
- bellow 8050 is bearish
At least for the short term we should expect some rebound, the price is again too far from MA50 on the hourly chart and at support MA50 and trend line on the daily chart
 The bears are using again a lot of energy to push the market lower. VIX is spiking higher. Now its not only the oscillator the Summation index and the weekly stochastic of the summation index a nearing oversold levels. If I look at the indicators I would say we are nearing intermediate term bottom.


Jun 11, 2013
Short term update
Short term signal: DOWN --> it will turn up if SP500 moves back above EMA50 on the hourly chart ~1635.
Intermediate term signal: UP --> bellow 1620 it will start looking bearish
Comment: red day as expected. The price is in no man's land between MA20 and MA50 on the daily chart. Taking in account the oversold oscillators
which we saw and the current move lower which is corrective, the preferred scenario relief rally stays valid but in the next day or two the bulls should move the prices higher.
Expected behavior(see the daily chart from weekly review):
- green scenario retest of the high - the market action favors this scenario.Tomorrow we should see short term bottom and a move higher after that.
- red scenario higher high - the alternate scenario has lower probability now, which is expected.
Levels SP500:
- above 1620 stay long
- 1600-1620 on the side line, wait and see what happens
- bellow 1600 short
XETRA DAX - Short term if DAX moves below 8150 expect move to the next support level 8050
Levels Xetra DAX:
- above 8150 stay long
- 8050-8150 on the side line, wait and see what happens
- bellow 8050 short
Both indexes SP500 and DAX touched the levels which should hold 1622 and 8150. The buyers showed up and if the levels hold the next leg up should begin. We will see what happens the rest of the day and after the close I will post the signals and the levels.
The two possible targets if I am right that there is more upside - A-B-C with A=C ~1673 and H&S with C=1,618xA 1698-1703.


Jun 10, 2013
Short term update
It is clear for today...
Short term signal: UP --> if SP500 moves bellow 1639 short term direction will be DOWN and next support level is 1622.
Intermediate term signal: UP
Comment: a pause as expected, the picture stays bullish, SP500 struggles with resistance and MA20 on the daily chart.
Expected behavior(see the daily chart from weekly review):
- green scenario retest of the high - the buyers are not so strong and the next day or two move lower but it should stay above 1622.
- red scenario higher high expected - the buyers are strong and tomorrow should be a strong green day moving above resistance and MA20.
Levels SP500:
- above 1620 stay long
- 1600-1620 on the side line, wait and see what happens
- bellow 1600 short
XETRA DAX - Short term if DAX moves below 8290 expect move to the next support level 8220-8230
Levels Xetra DAX:
- above 8150 stay long
- 8050-8150 on the side line, wait and see what happens
- bellow 8050 short
Jun 9, 2013
Short term update
Now I have more time and energy to pay attention to the markets. As I have promised in one of my comments it is time to combine analysis and the signals of the trading system for better trading, to organize myself better and be disciplined. That means every day after the close to check the signals of the system, check the levels where there will be trend change (short or intermediate term) and put concrete numbers on the table. Create plan for the next day and act accordingly.
No emotions, a plan with concrete numbers and the discipline to follow it. That is what you need to be successful trader.
I am starting today and I will post every day after the close.
Short term signal: UP
Intermediate term signal: UP
Comment: The analysis say a significant correction is coming. We will follow the market higher, but not getting too excited. Until we see something else we stay bullish.
Expected behavior:
- green scenario retest of the high - short pause in the next day or two and move lower to ~1620
- red scenario 20week/40week cycle low and higher high expected - pause is possible sideway move,but green days and no move lower to ~1620.
Levels SP500:
- above 1620 stay long
- 1600-1620 on the side line, wait and see what happens
- bellow 1600 short
Levels Xetra DAX:
- above 8150 stay long
- 8050-8150 on the side line, wait and see what happens
- bellow 8050 short
Jun 8, 2013
Weekly review
Short term view - the market taking breath for 1-2 days and move higher.
Intermediate term view - some kind of a test of the high and the real correction to begin.
Trading system signal (swing trading) - Direction: UP | Last entry signal: at SP500=1617 on 06.06.2013 | Stop at: 1618
The market stretched to the downside to the limit, tested the break out of the previous high and reversed. The support level around 1600 was on my radar as lower boundary for this correction, but I thought with oversold indicators the reversal will come earlier. I must not forget that the game is f**k most of the traders and almost always the price moves to the limit up or down.
The plan works very good for now. Next we should see a relief rally for a while and retest of the high. The price action and the indicators look almost 1:1 compared with April 2012 and I think will see something similar.
The alternate scenario is marginal new high with divergence before the correction. It is shown in red on the second chart. This scenario will be on the radar and we should take it serious:) Reasons:
- f**k most of the traders - when most of the traders, bears and bulls, will be fooled? - marginal new high suck in the bulls and kill the bears.
- the move lower were clearly corrective, so another move higher will not be a surprise.
- very oversold indicators as we had correction(7%-8%) behind us, but only oscillators not trend following indicators.
- Tom Demark setup at 7 on the weekly chart. At least 2-3 weeks higher will fit perfect to finish the setup.
- the cycles tell me this should be a 20 and 40 week cycles low which means several weeks move higher. We saw already explosive move from the low which is typical for such cycle lows.
TECHNICAL PICTURE
Short term - the price is in a resistance zone. I expect some kind of a pause and test of the broken trend line and the gap around 1622. The pattern looks like IHS with target around 1680.

- Triple cross(EMA10 and EMA20 crossing EMA50) - after a pause a new short term up trend should be confirmed.
Intermediate term - added an alternate scenario. I have explained the reasons above. Lets see how the market moves higher.

- Trend direction EMA50/MACD - the price is above EMA50 and MACD above zero so the intermediate term trend is still up.
- Momentum Histogram/RSI - momentum has turned up.
Long term - the bigger picture has not changed. We have bullish candle which opens the door at least for a relief rally 1-2-3 weeks... we will see.

- Trend direction EMA50/MACD - price is above EMA50 and MACD above zero so the long term trend is up.
- Momentum Histogram/RSI - RSI is still strong, the histogram shows divergence... momentum is without clear direction.
MARKET BREADTH INDICATORS
The Market Breadth Indicators - show at first glance conflicting signals. The oscillators like McClellan Oscillator and Advancing/Declining issues reached very oversold levels. The trend following indicators like Bullish Percentage for example are still pointing down. My conclusion is that in worst case we will see relief rally at least 61,8% and the more bullish scenario is higher high.
McClellan Oscillator - reached extreme oversold levels bellow 100 and the sharp reversal is not a surprise.
McClellan Summation Index - still showing sell signal.
Weekly Stochastic of the Summation Index - still showing sell signal.
Bullish Percentage - still showing sell signal.
Percent of Stocks above MA50 - in no mans land...
Fear Indicator VXO - jumped sharply and now moves lower for a higher low as expected.
Issues Advancing - hit extremes, at least a pause is in the cards.
Issues Declining - hit extremes, at least a pause is in the cards.
HURST CYCLES
The only way which I can count the cycles is that we saw 80day/20week/40week cycle low.
Look at RSI - every time when it touches the support line we have 80day cycle low. I do not know why this time should be different.

We have 20week/40week low. This argues that we should see strong move higher.... or something like double top and top of the 18 month cycle. We will know soon which one will be.

Tom Demark SEQUENTIAL AND COUNTDOWN - this technique spots areas of exhaustion.
Setup at 7 on the weekly chart. At least 2-3 weeks higher to finish the setup fits perfect with the technical analysis.

Jun 7, 2013

Jun 6, 2013
Short term update
One of the oversold indicators which I ma talking about. My forecast all the time was and stays the same - test of MA50 and another move higher before the real correction. NYMO seems to support my view. I can not imagine this move continuing without relief rally.


Jun 5, 2013
Short term update
I was a little bit too early calling for a short term bottom... I would have stuck to the weekend forecast something between 1600-1620.
If I look at only the indicators without a chart I would say we are near to the end of a correction 8%-10% Market breadth indicators, the histogram are oversold and at levels which usually mark intermediate term bottom. If you look at the chart you will see just a normal pullback 4%-5% and the price is testing MA50 and the channel. That is not very good for the bears,the market is already too stretched to the downside. I can not imagine a lot more to the downside, but who knows....


Jun 4, 2013
Short term update
Something between the green and red scenario has played out. If I am right tomorrow should be a strong green day to confirm a move up. If I am wrong the SP500 will break bellow the last minor low ~1622 and move to the next support level 1590-1600.


Jun 3, 2013
Short term update
I expect something like that to play out. The trend line touched at 1622 just two points higher than my upper target. Seven days and 3,9% pullback - typical size and length for such a move... so there is very high probability that this pullback is over. Alternate scenario is one more push lower.


Jun 1, 2013
Weekly review
Short term view - more to the downside in the next 2-3 days.
Intermediate term view - there is probability that the expected correction has begun.
Trading system signal (swing trading) - Direction: DOWN | Last entry signal: at SP500=1646 on 31.05.2013 | Stop at: 1645
A lot of up and down whole week and then the last two hours on Friday showed that A-B-C was the right choice. The move looks like an impulse and we are in wave 3 which is not finished. That means 2-3 days more downside and target A=C ~1620. Support, MA50 and the trend line are between 1600-1610. So I expect short term bottom between 1600 and 1620.
I was expecting after this pullback another move to the highs - test of the highs or marginal new high... Now on one side the weekly chart does not look very nice with two bearish candles and divergence on the histogram, on the others side a lot of indicators are moving lower rapidly and the McClellan Oscillator for example is already very oversold and when we see such levels some kind of a bottom follows.
My interpretation - expect short term bottom in the 1600-1620 area and deep retracement before a plunge for two weeks to lower levels. The charts are updated accordingly.
TECHNICAL PICTURE
Short term - looks like impulse and we are in wave 3. Target is between 1600-1620 before short term bottom. On Monday we should see confirmation with a red day.

- Triple cross(EMA10 and EMA20 crossing EMA50) - short term moving averages and price bellow EMA50. Short term direction is down.
Intermediate term - I moved the target for the correction a little bit higher. Looking back in the history(the three marked areas on the weekly chart bellow) - the correction was 38,2% Fibo retracement around 7% move lower. For the current move that means ~1550. We must admit that this move looks stronger and parabolic compared to the others so we should suggest that a deeper correction is possible. A deep correction is 10%-11% and 50% Fibo point to ~1520. So I will watch the 1520-1550 area for the end of an intermediate term correction.

- Trend direction EMA50/MACD - the price is above EMA50 and MACD above zero so the intermediate term trend is still up.
- Momentum Histogram/RSI - momentum is down.The histogram is bellow zero and RSI broke its trend line but it is still above its support line.
Long term - the bigger picture has not changed. We have bearish candles and momentum pointing down - histogram lower bars with divergence, RSI tested its broken trend line and turned down(see cycles weekly chart). Expect more downside in the next weeks.

- Trend direction EMA50/MACD - price is above EMA50 and MACD above zero so the long term trend is up.
- Momentum Histogram/RSI - momentu pints down and we have histogram divergence so we can expect something on the down side for several weeks.
MARKET BREADTH INDICATORS
The Market Breadth Indicators - all issued sell signals saying we should take this move serious. But there is no evidence for a major top.
McClellan Oscillator - in oversold territory outside the bollinger band and we should see short term bottom soon.
McClellan Summation Index - in sell mode since last week confirming the move lower.
Weekly Stochastic of the Summation Index - issued sell signal, there is high probability that the correction has already begun.
Bullish Percentage - issued sell signal but still strong. This is the reason why I think that this is not a major top.
Percent of Stocks above MA50 - dropping rapidly, high amount of stocks is moving bellow MA50.
Fear Indicator VXO - after higher lows and a tight bollinger band a sharp jump was expected. We should see higher high to confirm that this time the correction is for real.
Issues Advancing - broke bellow its support since November confirming that a significant amount of shares is moving lower.
Issues Declining - broke above its resistance since November confirming that a significant amount of shares is moving lower.
HURST CYCLES
The shorter cycles are not very clear and I will concentrate on the longer ones - and they say the 80 day nominal cycle(~40 trading day) cycle has topped and the indexes should move lower in the next 2-3 weeks.

The 20 week cycle probably has topped and we should see sharp move lower into 20 and 40 week cycle low.

Tom Demark SEQUENTIAL AND COUNTDOWN - this technique spots areas of exhaustion.
Tom Demark sequential is not very helpful in the last several weeks....

Subscribe to:
Posts (Atom)