
Jan 27, 2015
Update
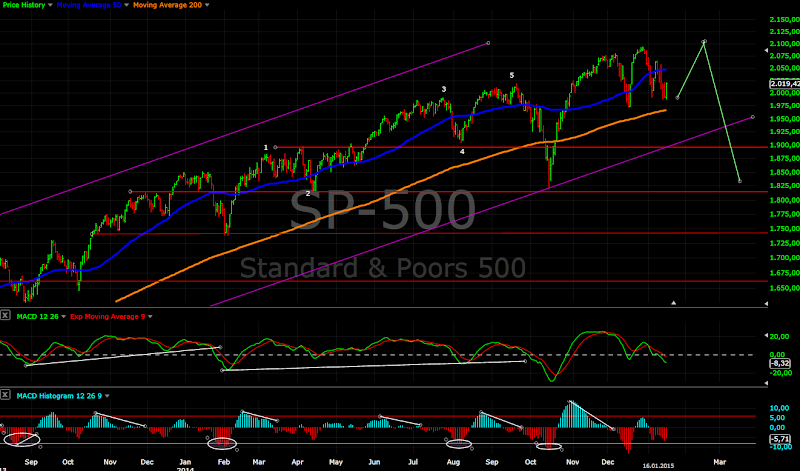
Here is the short term chart updated with all three scenarios on one chart before FOMC.
The week has started lower before FOMC as expected. The move looks corrective no impulse and the intraday move higher... could be an impulse, but not convincing so far.
So no change - triangle will look perfect with one more push lower with the same size for a-b-c or E of the triangle(green), second most probable scenario move higher has begun(yellow) and impulse lower for C(red)... the problem is there is no impulse.
Now FOMC should deliver something positive tomorrow:)

Jan 25, 2015
Weekly review
Short term view - lower for the start of the week than higher.
Intermediate term view - expecting correction of a bigger degree, but it is a few weeks away.
The indexes moved higher as expected, but we saw only one strong day for the US indexes and there was a lot of selling on strength. I suppose this QE is priced in already, or the market is simply tired. In contrast Europe was very strong working on the expanded flat if I am right.
The choppy pattern is almost two months old an continue to develop. The price action this week did not give us a clue what is happening. There is still many different options.
On the first chart is shown a triangle, on the second chart ending diagonal and there is more bearish scenario shown on the daily cycle chart below.
I do not see impulses lower and we are nearing a 20 week cycle low so even if we see the most bearish scenario from the three above, the time to be bearish will come later now it is too early.
On Wednesday we have FOMC so I will bet on the ED or triangle. If the price stays before FOMC above the low from Thursday around 2025 we should see ED. If it breaks below this level it is probably a triangle.
TECHNICAL PICTURE
Short term - the triangle is shown... Monday and Tuesday should be strong down days breaking below MA50 and the low from last Thursday.

Intermediate term - weakness on Monday and grinding higher for w3 of an ED.

Long term - no change. Momentum points lower with divergence.

MARKET BREADTH INDICATORS
The Market Breadth Indicators - does not help us much too. For the longer term divergences and something bigger to the downside, but for the short term no clue.
McClellan Oscillator - looks like a triangle too, with higher lows and lower highs.
McClellan Summation Index - I do not know...
Weekly Stochastic of the Summation Index - can not take a decision lower or higher:)
Bullish Percentage - sell signal, but turned up.
Percent of Stocks above MA50 - in the middle of the range near 50.
Fear Indicator VIX - moved relatively higher so it favors more bullish outcome for the short term.
Advance-Decline Issues - in the middle of the range near 0.
HURST CYCLES
Cycles are not clear at the moment. Both scenarios are equally probable.
Here is the bearish scenario lower in the next 2-3 weeks.
More bullish scenario we saw the bottom last week and we are currently at week 1 of the next 20 week cycle.
Tom Demark SEQUENTIAL AND COUNTDOWN - this technique spots areas of exhaustion.
On the daily time frame the price is turning up and down for two months. On the weekly and monthly time frames there is finished countdown and combo.... It smells like a top for me.
The monthly chart - the wedge is so tight there is no more room left for the price to move:)))) It should break soon higher or lower. With QE news behind us and very weak reaction is there something left to move the market higher? Breaking lower looks more probable.
It will be interesting if we will see a second red month in a row. It has not happened since early 2012 almost two years:)
Intermediate term view - expecting correction of a bigger degree, but it is a few weeks away.
The indexes moved higher as expected, but we saw only one strong day for the US indexes and there was a lot of selling on strength. I suppose this QE is priced in already, or the market is simply tired. In contrast Europe was very strong working on the expanded flat if I am right.
The choppy pattern is almost two months old an continue to develop. The price action this week did not give us a clue what is happening. There is still many different options.
On the first chart is shown a triangle, on the second chart ending diagonal and there is more bearish scenario shown on the daily cycle chart below.
I do not see impulses lower and we are nearing a 20 week cycle low so even if we see the most bearish scenario from the three above, the time to be bearish will come later now it is too early.
On Wednesday we have FOMC so I will bet on the ED or triangle. If the price stays before FOMC above the low from Thursday around 2025 we should see ED. If it breaks below this level it is probably a triangle.
TECHNICAL PICTURE
Short term - the triangle is shown... Monday and Tuesday should be strong down days breaking below MA50 and the low from last Thursday.

Intermediate term - weakness on Monday and grinding higher for w3 of an ED.

Long term - no change. Momentum points lower with divergence.

MARKET BREADTH INDICATORS
The Market Breadth Indicators - does not help us much too. For the longer term divergences and something bigger to the downside, but for the short term no clue.
McClellan Oscillator - looks like a triangle too, with higher lows and lower highs.
McClellan Summation Index - I do not know...
Weekly Stochastic of the Summation Index - can not take a decision lower or higher:)
Bullish Percentage - sell signal, but turned up.
Percent of Stocks above MA50 - in the middle of the range near 50.
Fear Indicator VIX - moved relatively higher so it favors more bullish outcome for the short term.
Advance-Decline Issues - in the middle of the range near 0.
HURST CYCLES
Cycles are not clear at the moment. Both scenarios are equally probable.
Here is the bearish scenario lower in the next 2-3 weeks.

More bullish scenario we saw the bottom last week and we are currently at week 1 of the next 20 week cycle.

Tom Demark SEQUENTIAL AND COUNTDOWN - this technique spots areas of exhaustion.
On the daily time frame the price is turning up and down for two months. On the weekly and monthly time frames there is finished countdown and combo.... It smells like a top for me.
The monthly chart - the wedge is so tight there is no more room left for the price to move:)))) It should break soon higher or lower. With QE news behind us and very weak reaction is there something left to move the market higher? Breaking lower looks more probable.
It will be interesting if we will see a second red month in a row. It has not happened since early 2012 almost two years:)

Jan 17, 2015
Weekly review
Short term view - move higher expected...
Intermediate term view - expecting correction of a bigger degree, but it is a few weeks away.
Ok I am back online:) After several weeks I see only choppy price action, volatility is rising ,the pattern is not clear. Overall nothing new... it is interesting if you are short term or day trader. For the short term I think the indexes will move higher frontrunning the ECB QE decision which now everybody think is 100% sure. Longer term I still think that we will see a bigger correction 10%-15% followed by another rally to ATH, but it is too early to get bearish - wait 2-3 weeks. What I see is: - technical indicators - the weeekly indicators are bearish the daily bullish. In such situation usually the weekly time frame wins but it takes time the shorter time frame to synchronize with the longer time frame. - market breadth indicators - look like we are near to a bottom, but not important bottom. I suspect short term bottom. - cycles - the indexes are nearing another 40 day and 20 week cycle. It is hard to say if we saw it this week... ideally we should see another 1-2 weeks lower and the price below 1975 before a bottom. - elliot waves - I do not see an impulse lower... so I can not be bearish at the moment. To sum it up - higher probability we have short term bottom and move higher probably ATH before an intermediate term correction. Backup plan the 20 week cycle low comes in 1-2 weeks... but I am not bearish at the moment for the next 2-3 weeks. About ECB and QE - first when there is important news/event when the big boys want to sell they push the prices higher to sell higher and the opposite, second I think EUR/USD is near to an intermediate term bottom. I think with or without QE from ECB it will be sell the news event. I do not expect long lasting rally. SNB shocked everybody, we have ECB QE decision, Greek election, FOMC in the next 2 weeks... such events do not change the trend but cause sharp moves in both directions and add to this choppy price action, nervous traders, rising volatility. So I do not trade this market, I like low risk. I bought for the short term natgas(UGAZ) and for the intermediate term coffee(JO) and I am watching the show:) Why bother trading the indexes? Let the dust settle down and wait patiently for a lower high or higher high with divergence. P.S. I wrote that someday CBs will start do crazy things and eventually lose control. Well it did not last too long:) the first one SNB gave up and just let it go. This is the right decision let the market do its job. If they did this in 2008 the crises would be history long ago.... TECHNICAL PICTURE
Short term - move higher... I think it has begun worst case I think we will see a fake break lower before moving higher.

Intermediate term - the plan has not changed. One final move higher followed by intermediate term correction.
Long term - no change. Momentum has turned lower with divergence.

MARKET BREADTH INDICATORS
The Market Breadth Indicators - not very clear signals. I would tip on short term bottom.
McClellan Oscillator - choppy like the indexes.
McClellan Summation Index - sell signal
Weekly Stochastic of the Summation Index - probably a bottom or final push lower.
Bullish Percentage - sell signal.
Percent of Stocks above MA50 - probably a bottom or one more push lower.
Fear Indicator VIX - should be near to a top
Advance-Decline Issues - somewhere in the middle....
HURST CYCLES
Cycles are not clear at the moment. Both scenarios are equally probable. It depends on how high the indexes will move before the ECB meeting and on the reaction after that.
The daily chart the bottom will come later after two weeks probably(lower high after the ECB meeting).
Or we saw it this week right on time at week 14 (near ATH before ECB).
Tom Demark SEQUENTIAL AND COUNTDOWN - this technique spots areas of exhaustion.
Nothing interesting.... choppy moves.
Intermediate term view - expecting correction of a bigger degree, but it is a few weeks away.
Ok I am back online:) After several weeks I see only choppy price action, volatility is rising ,the pattern is not clear. Overall nothing new... it is interesting if you are short term or day trader. For the short term I think the indexes will move higher frontrunning the ECB QE decision which now everybody think is 100% sure. Longer term I still think that we will see a bigger correction 10%-15% followed by another rally to ATH, but it is too early to get bearish - wait 2-3 weeks. What I see is: - technical indicators - the weeekly indicators are bearish the daily bullish. In such situation usually the weekly time frame wins but it takes time the shorter time frame to synchronize with the longer time frame. - market breadth indicators - look like we are near to a bottom, but not important bottom. I suspect short term bottom. - cycles - the indexes are nearing another 40 day and 20 week cycle. It is hard to say if we saw it this week... ideally we should see another 1-2 weeks lower and the price below 1975 before a bottom. - elliot waves - I do not see an impulse lower... so I can not be bearish at the moment. To sum it up - higher probability we have short term bottom and move higher probably ATH before an intermediate term correction. Backup plan the 20 week cycle low comes in 1-2 weeks... but I am not bearish at the moment for the next 2-3 weeks. About ECB and QE - first when there is important news/event when the big boys want to sell they push the prices higher to sell higher and the opposite, second I think EUR/USD is near to an intermediate term bottom. I think with or without QE from ECB it will be sell the news event. I do not expect long lasting rally. SNB shocked everybody, we have ECB QE decision, Greek election, FOMC in the next 2 weeks... such events do not change the trend but cause sharp moves in both directions and add to this choppy price action, nervous traders, rising volatility. So I do not trade this market, I like low risk. I bought for the short term natgas(UGAZ) and for the intermediate term coffee(JO) and I am watching the show:) Why bother trading the indexes? Let the dust settle down and wait patiently for a lower high or higher high with divergence. P.S. I wrote that someday CBs will start do crazy things and eventually lose control. Well it did not last too long:) the first one SNB gave up and just let it go. This is the right decision let the market do its job. If they did this in 2008 the crises would be history long ago.... TECHNICAL PICTURE
Short term - move higher... I think it has begun worst case I think we will see a fake break lower before moving higher.

Intermediate term - the plan has not changed. One final move higher followed by intermediate term correction.

Long term - no change. Momentum has turned lower with divergence.

MARKET BREADTH INDICATORS
The Market Breadth Indicators - not very clear signals. I would tip on short term bottom.
McClellan Oscillator - choppy like the indexes.
McClellan Summation Index - sell signal
Weekly Stochastic of the Summation Index - probably a bottom or final push lower.
Bullish Percentage - sell signal.
Percent of Stocks above MA50 - probably a bottom or one more push lower.
Fear Indicator VIX - should be near to a top
Advance-Decline Issues - somewhere in the middle....
HURST CYCLES
Cycles are not clear at the moment. Both scenarios are equally probable. It depends on how high the indexes will move before the ECB meeting and on the reaction after that.
The daily chart the bottom will come later after two weeks probably(lower high after the ECB meeting).

Or we saw it this week right on time at week 14 (near ATH before ECB).

Tom Demark SEQUENTIAL AND COUNTDOWN - this technique spots areas of exhaustion.
Nothing interesting.... choppy moves.
Subscribe to:
Posts (Atom)